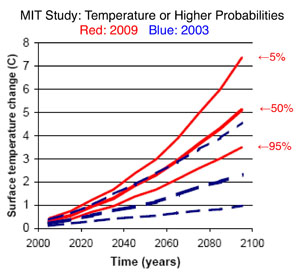
So, what does this graph say? It says that in a business-as-usual ("no policy") scenario, there is a 50% chance that the temperature will 5C (9F) or more warmer in 2095 and there is a 95% chance that it will be 3.5C (6.3F) or more warmer in 2095!
Scientists tell us that going past 2C (3.6F) warmer will be disaster. As I said in my previous post, 2C (3.6F) warming will be really bad, 3C (5.4F) will be biblical, and at 4C (7.2F) and above, we face the possible collapse of agriculture, the economy, and perhaps civilization itself. It may be "Game Over" at 6C (10.8F) and above.
We can see from the graph that there is a 50% chance we will cross the 2C (3.6F) "danger line" between 2040 and 2050, and there is a 95% chance will will cross it by 2060 or before.
From here, citing this report.
The red lines are the current predictions. The blue lines are the predictions made in 2003 by the authors of the current study.
Who would have guessed that air pollution is more likely to do us in than nuclear war or a comet?
2 comments:
Anyone who looked at that particular model, didn't observe that the model predicted significant net warming in the last 5 years (when there's been net cooling) and pays no attention to the increasing number of climate scientists who think these models are, quote "like ancient astrology".
The position taken by the individuals in the link are widely discredited. Also, there has not been net cooling in the last five years.
Your information sources are faulty.
The argument that natural warming and cooling cycles are driving our current global warming trend is completely discredited, as National Academy of Sciences, UN and other reports attest.
Post a Comment