We can get focused on immigration to the U.S. from outside the U.S., and lose track of the massive amount of internal migration that the United States has as well.
Also, since every state has people both leaving it and moving there, the net population changes attributable to migration understate the extent to which the U.S. population churns between states.
This also suggests that "voting with one's feet" is a significant force in the incentives facing individual states in our federal system, not just in the highly publicized area of competitions between states to win new federal government and business jobs, but at the level of individuals.
Generally speaking, a high percentage of people who were born outside the state is a positive economic indicator, that suggests something is attractive about the state that is bringing people there, while a low percentage of people who were born outside the state is a negative economic indicator. The linked story called the places where the most people didn't move "the stuck belt."

Percentage of people age 25 years or older in each state who were born in that state via Bloomberg in a March 5, 2019 story by demographer and regional development economist Richard Florida who in turn is relying on data from the 2017 American Community Survey (which the Census Bureau in the U.S. Department of Commerce conducts between decennial censuses).
The linked story notes that:
Nearly six in ten Americans (58.5 percent) currently reside in the state where they were born. There is a minuscule difference between men and women: A slightly higher percentage of men (58.8 percent) lived in their birth state compared to women (58.2 percent).
The 12 States With The Most Mobile Populations
In one state, Nevada, only 10% of residents over age 25 were born there.
In three more states, more than 20% but less than 30% of residents over age 25 were born there. Those state are Florida (22%), Arizona (23%), and Alaska (27%).
In eight more states, more 30% but less than 40% of residents over age 25 were born there. Those states are Washington State, Oregon, Idaho, Wyoming, Colorado, Maryland, Delaware, and New Hampshire.
All but four of the states with the lowest percentage of people over age 25 who were born there are in the West, and those four states are all on or near the East Coast.
Age And Migration
Anecdotally, three of the states with the lowest percentage of residents over age 25 who were born there: Nevada, Florida and Arizona, are known for their large communities of migrating retirees. It is plausible that migration patterns may be quite different for retirees and for people of working age. The data don't unequivocally confirm this intuition, however.
A map showing a breakdown of states by the percentage of the population age 65+ sheds some light on this, although it doesn't distinguish between migrants and people born in the state:

Across the total U.S. population, 16.0 percent of Americans are over the age of 65, while 6.7 percent are over the age of 75. The median age in the United States is 38.2.
This source notes which states have the fewest seniors:
The three states with the most youthful populations are Utah, Alaska, and Texas. These three states are home to residents over age 65 who make up 11.1, 11.9, and 12.5 percent of the total population, respectively.
In Utah, this is due to the high birth rates of the Mormon majority. In Alaska and Texas, this is probably driven mostly by migration of younger people to these states, particularly in connection with the oil and gas industry, although a large Hispanic Catholic population and lots of immigration from Mexico may be another factor in Texas. This may also be driven by seniors moving away from the tough climate of Alaska to warmer destinations further south.
The 14 States In The Stuck Belt
In eleven states, more than 60%, but not more than 70% of residents over age 25 were born there. Those states are North Dakota, Minnesota, Wisconsin, Iowa, Missouri, Indiana, Pennsylvania, West Virginia, Kentucky, Mississippi, and Alabama.
In three states, more than 70% of the residents over age 25 were born there. Those states are Ohio (71%), Michigan (72%), and Louisiana (74%).
Illinois (at about 55%) is the only state in the Midwest where less than 60% of residents over age 25 were born there, and that is without a doubt, predominantly due to the Chicago metropolitan area.
These states have been affected by interstate migration as well, but more by emigration than immigration.
Every state, however, has at least 26% of residents over age 25 who were not born there.
The 24 In Between States
In the remaining twenty-four states, more than 40% but less than 60% of residents over age 25 were born there.
[The] larger coastal states like California and New Jersey have rates in the low 40 percent range. New York and Illinois have significantly higher shares of people, roughly 55 percent, who were born in those states.
Foreign Born Migrations v. Interstate Migrants.
The percentages of the population not born in each state includes both foreign born people who were born outside the U.S. and interstate migrants. The percentage of the total population born outside the state in some select states is as follows:
California 26.7%New Jersey 23.4%
New York 22.4%
Florida 21.1%
Nevada 19.8%
Massachusetts 17.3%
Texas 17.1%
Maryland 15.4%
Washington 14.9%
Illinois 13.9%
Arizona 13.4%
Virginia 12.7%
Georgia 10.3%
North Carolina 8.4%
Pennsylvania 7.0%
Education and Mobility
The link between education and mobility isn't particular consistent. The story also parses out the data by education level:
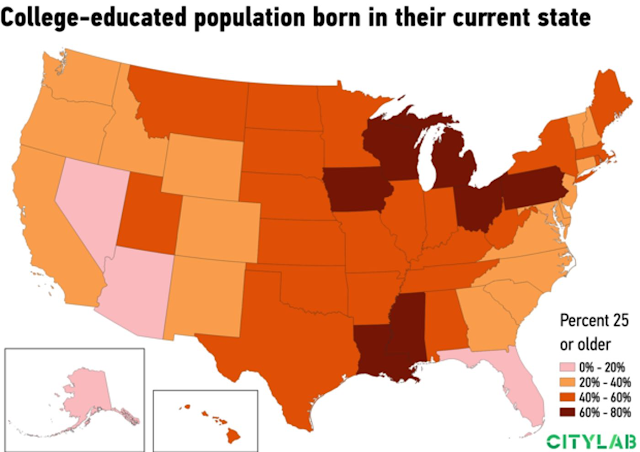
Louisiana again tops the list with nearly two-thirds of its adults who hold a bachelor’s degree or more remaining in the state, followed by Michigan (64 percent), Ohio (63 percent), and Mississippi and Iowa (62 percent).
The most significant way in which U.S. states discriminate based upon state residency is by charging significantly less for tuition a state colleges and universities to students who are state residents than to students who reside outside the state (although some states are more strict about this than others, and there are a few states, mostly smaller states with less complete higher educational offerings, with interstate compacts allowing residents of states that are part of the compact to receive in state tuition at a sister state, and there are some state colleges and universities that offer instate status or special scholarships to members of certain Indian tribes outside the state, such as Miami University of Ohio for members of the Miami Indian tribe).
Presumably, because economics teaches us that incentives matter, this means that new high school graduates are more likely to attend college in their own state than they are in another state. The high percentages of in state students at most state colleges and universities, especially the less academically selective ones, supports this conclusion. Thus, this distinction provides a return on taxes paid to parents have lived in the state and mostly paid significant taxes, since parents of students attending state colleges and universities, especially the more selective ones that have the highest subsidies per student, are much more affluent than average parents in those states.
Statistics about the likelihood of state college and university students living in a state after graduation (which is when the general public in a state receives the benefit of this state subsidy) are harder to come by. But it is safe to guess, from mere inertia, that graduates of state colleges and universities in a state are more likely to live in that state after graduating than graduates of colleges and universities outside the state (and probably also, are more likely to do so than students of the more selective of the private colleges and universities within the state).
As a matter of economic development policy, a state would typically like to lure smart students from outside the state to go to college there, with the hope that those students will later contribute to that state's economy, although no state binds graduates of its colleges and universities to do so. This may happen behind the scenes to some extent through scholarships awarded to out of state students at more selective state colleges and universities. But the tuition tax breaks given to in state students at almost every state college and university without regard to merit or financial need, suggest that this reason for funding state colleges and universities is not a primary motive for state legislators funding state colleges and universities in state budgets.
In contrast, many European countries extend the full economic subsidies they provide to domestic college students to college students from abroad enrolling in their regular college and university programs.

Louisiana again tops the list with roughly three-quarters of its adults who did not complete high school native to the state as does West Virginia (75.6 percent), followed by Mississippi (72.9 percent), and Kentucky (72.6 percent).

No comments:
Post a Comment