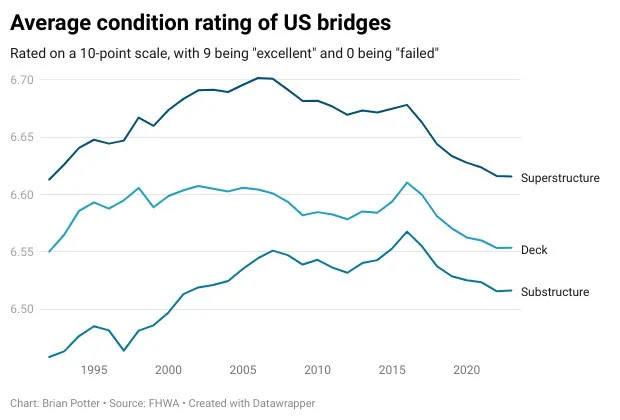
The average quality of bridges in the U.S. is falling slightly, but only about a third as many bridges in very bad condition as in 1990 (interestingly coinciding with falling crime rates as well).
On the other hand, the fact that even 1% of bridges in the U.S. are in critical condition or worse, even if this is only a third of the number of bridges that were in this state in 1990, is still very concerning. At the current rate of improvement, it will take the U.S. until about the year 2050 or so to get all of its bridges out of a critical condition state.
Yes, transportation infrastructure officials have had their priorities straight, but there is still an underinvestment in infrastructure in the U.S.
The author of the blog that is the source of these charts notes that:
Since bridges are both getting older and handling more traffic, we might expect their condition to get worse as they accumulate more wear and tear. We do see a very slight decline in the average rating of deck, substructure, and superstructure since the mid-aughts (prior to that, average rating was increasing over time). Note the vertical axis here: this decline is VERY slight.A rating of between 6 and 7 corresponds to the average bridge being somewhere between 'good' and 'satisfactory', more or less in-line with the ASCE's rating of "C" for our bridges in the most recent infrastructure report card.
For comparison purposes, here are some crime rate statistics trends (from prior posts here and here):


No comments:
Post a Comment