Motivation
I've complained that surface combatants in the world's navies are too vulnerable - to submarines with anti-ship missiles and torpedos, to other ships with anti-ship missiles and torpedos, to aircraft with bombs and anti-ship missiles, to land based anti-ship missiles, and to sea mines.
Surface combatants also put lots of people in harm's way. It is like going to a battle in a land war in an RV. Also, current warships have at least twice as many crew as would be necessary in a more modern, more automated ship.
A Notional Navy Group To Replace A Destroyer
What might an alternative, at a cost comparable to that of a current technology Arleigh Burke-class destroyer of about $2 billion each, which provides 96 vertical launch system (VLS) missiles, and some secondary armaments, defense systems, and sensors?
* Suppose that you had 12 catamaran style missile boats with about 200 tons each (or less), with 8 VLS class sized missiles each, that could be reloaded at sea, and accommodations for a very small crew of four for just 24 hours, similar to China's Houbei class 220 ton (140 foot long) Type 22 missile boat.

It would be powered by batteries with 24 hours of power. With the energy density of solid-state batteries that would require to battery units of about 20 tons each (the total battery size is in the ballpark of the amount of fuel needed for a comparable sized Skjold-class missile boat which requires 35-40 tons of fuel with a range of about 800 nautical miles, which is about 32 hours of operation, and 270 tons of displacement, benchmarking to the Ellen E-Ferry, also here). Collectively, they would have the same VLS class missile capacity as a destroyer. They would be minimally manned, rather than fully unmanned (which would be technologically feasible), in order to undermine the effectiveness of methods like electronic jamming that can undermine remotely operated drones, to avoid the hard to quantify risks of having military armaments controlled purely by an artificial intelligence system, and to have someone alert and ready to immediately summon assistance in the event of an attempted boarding or if something else goes wrong. These boats would have some minimal additional weapons and/or active defense systems designed to thwart income missiles and drones including electric jamming systems and a 5 megawatt laser and a mounted heavy machine gun. These would have a crew of four. It would also have a small, electric drone that would be primarily for reconnaissance but would have an equivalent of a 6.8 mm round rifle. These would have the ability to go considerably faster than traditional naval surface combatants (about 80 km/hr v. about 55 km/hr for a modern Arleigh Burke destroyer), although they wouldn't need to be terribly fast. They could operate in shallow littoral waters. Lasers would reduce the supply chain relative to canon round or shells or missiles.
* These missile boats would be escorted by two catamaran style escort corvettes of under 750 tons each with hydrofoils, with no VLS class missiles or torpedos or large naval artillery guns, that would have anti-aircraft missiles suitable for jet fighters and bombers at higher altitudes, a small boarding speed boat, and armaments including at least one 5 megawatt laser and electronic jamming, javelin missile sized missiles, stinger missiles, one or more 25mm-40mm canons, and remotely operated 12.7mm machine guns, designed to take on missiles, airborne drones, small surface boats (e.g. pirates and boarding boats and armed speed boats), unmanned surface drones like the adapted jet ski drones used in the Black Sea by Ukraine. These would be vaguely similar to Swedish Visby-class corvettes or the U.S. Navy Pegasus-class patrol boats (see also here).
AVisby-class corvette
A Pegasus-class patrol boat
These would also have accommodations for only a minimal crew for just 24 hours. It would be powered by batteries with 24 hours of power. These might have a crew of twelve. It would also have a medium sized electric drone that would be primarily for reconnaissance but would have an equivalent of a 12.7 mm round rifle. One escort corvette in the group would have a sea adapted AH-64 helicopter gunship, and the other would have a more typical naval military helicopter (e.g. a Sea Hawk SH-60) suited to carrying a boarding party or search and rescue, and would have its own somewhat less powerful armaments and could provide limited anti-submarine warfare capabilities. These corvettes would have the ability to go considerably faster than traditional naval surface combatants (about 110 km/hr v. about 55 km/hr for a modern Arleigh Burke-class destroyer), which it would use to chase small craft, to rush to the aid of a missile boat in peril, or to evade torpedos and shells. They could operate in shallow littoral waters. Lasers would reduce the supply chain relative to canon round or shells or missiles.
* Crews on the missile boats and escort corvettes would be replaced every twelve hours, and these surface combatants would have half of its batteries switched out, if electric, every twelve hours at the same time, from a small manned 60 ton tender submarine with a crew of two (similar to the U.S. Navy's Dry Combat Submersible), itself powered by batteries. The tender submarine would surface below the ship between the catamarans so that it would not be visible from above or from the sides shielded by the catamaran hulls. There might be four tender submarines.
* Additional ammunition and parts and supplies for the missile boats and escort corvettes would be stored on a 200 ton supply submarine (which is bigger than the eighty tons of the U.S. Navy's Orca drone), powered by batteries. Most of the time, this would operate as an unmanned drone in the vicinity of the watercraft that it supports. But when resupply was actually needed, a tender submarine would bring a small crew of two to four sailors to it and that crew would surface the supply submarine in the same place as the tender submarine appears and would load the ammunition or supplies onto the boat or corvette (e.g. additional VLS missiles, which each weigh about 1.5 tons, or repair parts, or attack helicopter missiles or attack helicopter fuel). The group might have two supply submarines.
* There would be about four fully unmanned 15 ton sensor drone surface boats (similar in size to World War I sixty foot long coastal torpedo motor boats), powered by batteries, armed only with sensors, although it would all be networked. Segregating radar systems on these unmanned surface vessels from the missile boats and escort corvettes would make the armed vessels less vulnerable to missiles that target radar sources.
A prototype medium unmanned surface vessel from the U.S. Navy looks like this:
* The aerial reconnaissance drones armed with small arms, and the sensor drones would be recharged by the missile boats and escort corvettes to which they were assigned from those manned surface vessel's batteries.
* There would be a single large nuclear submarine mothership of several thousand tons that would house the crews for the missile boats and escort corvettes and tender submarines and supply submarines when they are not on duty on their vessels in addition to its own crew, that would operate in deep waters, at perhaps a typical 100 meters of depth, at some distance (often as much as twenty kilometers) from the surface parts of the group. It would not have any torpedos or missiles of its own, and would have only the bare minimum of on board sensors and communications equipment, in an effort to minimize detection. It would provide long term living quarters for about 200 sailors and one squad of fifteen Marines. The mothership would have a desalinization plant and would carry long term food supplies for the crew. If this navy group ran short on ammunition or other supplies, empty supply submarines could be send home in drone mode, while a new full uncrewed supply submarine could be sent to replace it, without the whole group having to return to a naval base.
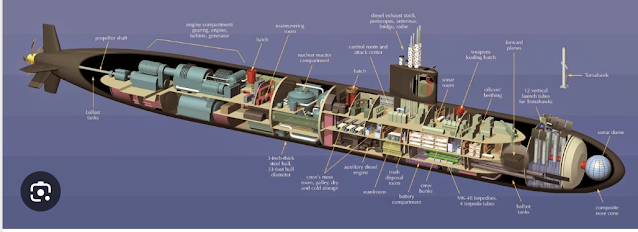
It would house about 50% more personnel than a U.S. 6,900 ton Los Angeles class nuclear attack submarine, but would have a lot of space freed up due to its lack of missiles and torpedos and related sensor systems (and a somewhat smaller engine), and it wouldn't have to be able to go quite as deep as a nuclear attack submarine (which is 200-300 meters) allowing for a thinner hull. So. it might actually be smaller than a Los Angeles class submarine, perhaps on the order of 5,100 tons with a dedicated crew of thirty-six sailors (oil tankers and container ships often have crews of twenty-four sailors or less) excluding the Marine squad. The crew space is a pretty modest share of a submarine's total displacement as this diagram of a Los Angeles class attack submarine indicates:
* The submarine tenders and supply submarines would dock to the mothership which would have an induction charging station for them to recharge as needed.
* The submarine tenders would take used batteries from the missile boats and escort corvettes to the mothership to exterior induction charging station brackets to recharge for up to ten hours if necessary from the mothership's nuclear power plant supplied grid, and then would be returned and traded out for the now used batteries at the missile boats and escort corvettes.
* The total tonnage of the ships in the naval group would be about 9,700, which is the same as the displacement of a single destroyer. The total crew would be about two-thirds the size of a destroyer's crew (by comparison the Zumwalt-class destroyers have about half the crew of the Arleigh Burke-class destroyer despite the fact that the Zumwalt-class destroyers have more than 50% more displacement).
Analysis
A single Arleigh Burke-class destroyer can be destroyed, or at least disabled and removed from action, with a single torpedo or anti-ship missile or sea mine, and puts almost 350 people in harm's way on the front lines of any naval battle. Since it is diesel powered, it need to be resupplied frequently from fixed naval bases or minimally armed tanker ships. It can't even reload VLS missiles at sea. And, it is a huge, slow, non-stealthy target.
In contrast, this navy group would spread that risk over fourteen manned surface combatants and four unmanned ones. The physical area over which the vessels in this naval group including the four sensor vessels, and the group's fourteen reconnaissance drones and two manned helicopters were located, would potentially provide situational awareness of threats and targets than sensors all squeezed onto the footprint of a single vessel. It would take a dozen and a half anti-ship missiles or torpedos to fully sink the entire group instead of one. And, if a vessel was lost, four to twelve sailors (or a few more if a tender submarine or supply submarine was docked with a missile boat or escort corvette at the time, rather than more than three hundred sailor's lives, would be lost.
The surface ships would also be smaller, faster targets, although with the accuracy of modern torpedos and anti-ship missiles that might not matter much.
Submarines are much harder to locate and destroy than surface combatants, and its takes multiple, highly specialized near peer resources that potential adversaries like North Korea and Iran lack, to do so effectively. So, the four tender submarines, two supply submarines, and mothership in the group would have greatly reduced vulnerability relative to the a destroyer. And, even if a few of the tender submarines or supply submarines were destroyed, the naval group could continue to function with only modest impairment. The mothership, by having no major sensors and not using weapons to draw attention to it, by operating at greater depths without ever surfacing, and by being miles away from the surface vessels in the fleet, would be at the lowest risk (although that risk is never zero).
If the mothership were damaged, the submarine tenders and supply ships (which would dump and abandon their cargo) could evacuate many, if not all, sailors on board (more than a third but less than half of whom would be aboard missile boats and escort corvettes and the ten support submarines already). The mothership could also have escape pods in lieu of life boats for sailors would could not be evacuate with its ten supporting submarines.
The group supported by the mothership to go for long periods of time without being resupplied, and could be resupplied covertly by drone submarines when it did need to be resupplied. But since only the mothership would have a nuclear power plant, the risk that this nuclear asset would fall into enemy hands would be reduced. An Arleigh Burke-class destroyer carries about 409 tons of diesel fuel when its full, which allows it to travel about 8,100 km at 37 km/hr (about 219 hours).
Despite the fact that a large portion of the naval group would be underwater, the fourteen armed surface warships would still be effective to "show the flag" which is a maneuver which politicians frequently desire.