11 February 2022

Demography Is Political Destiny

None of this is particularly surprising, but it doesn't hurt to note confirming opinions from third-party sources once and a while. The rankings are based upon three demographic considerations:

1) What percentage of the state's residents 25 or older have bachelor's degrees or higher?

2) What percentage of the state's residents are White?

3) How urban or rural is the state? . . . 
[T]he most demographically friendly state for Republicans is ... WEST VIRGINIA!

Yes, the same West Virginia that Sen. Joe Manchin, a Democrat, represents. That should convince any lingering Democratic doubters that the alternative to Manchin in the US Senate is almost certainly a Republican.

Here are the rest of the most GOP-friendly states in the top 10:

2. Wyoming
3. Kentucky
4. (tie) South Dakota, Idaho, North Dakota, Iowa
8. Montana
9. Maine
10. Arkansas

And here are the 10 most Democratic-friendly states:

1. Maryland
2. New Jersey
3. New York
4. California
5. Massachusetts
6. Hawaii
7. (tie) Connecticut, Illinois
9. Virginia
10. Colorado

Notably, the state at the top of the list here, Maryland, is represented by Republican Gov. Larry Hogan.

These rankings generally line up with recent presidential election results. Only two states in the top 10 for Republicans (Iowa and Maine) have voted for a Democratic presidential nominee in the last decade. And none of the 10 most Democratic-friendly states have gone for a Republican in the last decade.

Which state is in the demographic middle? 
Michigan, which ranks 25th. The state has played host to two very close presidential contests, in 2016 (won by Donald Trump) and 2020 (won by Joe Biden).

From CNN, citing the blog of Larry Sabato, a pundit and professor of political science at the University of Virginia. 

The District of Columbia, of course, is the safest Democratic party stronghold of all, although it only has a say in Presidential elections and doesn't have voting representation in Congress.

Reasons for Maine to be an outlier (e.g., it is in very secular leaning New England, where white rural voters are much more likely to favor Democrats than elsewhere) and indeed for most of nine other outliers when considering only the three main demographic factors above (which are all explained to a great extent by strength of religious belief) are easier to articulate than the reason that Iowa is a battleground state in national elections.

Iowa is the 15th least educated, the 6th most white, the 11th most rural, and the 19th most religious state and is tied for 4th most demographically Republican leaning on a composite index of the three demographic factors identified above.

Republicans Represent A Minority Of Americans Out Of Step With Modern America

We live in a divided nation. And, Republicans belong to a dying American culture deeply out of step with the rest of the nation, that wields outsized political power anyway. This is something that the 6-3 conservative majority on the U.S. Supreme Court has brought to a head. 

Similarly, but for gerrymanding inherent in the design of the U.S. Senate, Democrats would have a safe majority there, and wouldn't find their legislative initiatives blocks as they are in today's 50-50 Senate, despite the fact that they control the U.S. House, the U.S. Senate, and the Presidency.

If our broken political institutions didn't magnify this loud minority's political power, we would be living in a country with a profoundly different set of laws.
White Christians, who constituted a majority of Americans for most of the nation’s history, have fallen to about 44 percent of the total as the nation has grown more demographically and religiously diverse, according to the latest PRRI national data. But in PRRI surveys, about two-thirds of Republicans still identify as white Christians (a level last reached for the country overall in the mid-1990s). In 25 states, white Christians now constitute 49 percent of the population or more, per the PRRI’s findings. In 2020, Donald Trump won 18 of them. Those same states elected 37 of the 50 Republican senators. . . . 

Trump in 2020 won only two of the 20 states with the highest percentage of foreign-born residents, according to census figures, and Republicans hold only four of their 40 Senate seats. The GOP tilts toward the places least affected by immigration: Trump won 17 of the 20 states with the lowest share of foreign-born residents, and those same states elected 33 of the 50 GOP senators. Combined, those 20 low-immigration states account for only a little more than one-fifth of the nation’s total population. . . . 
Republicans dominate the states with the fewest college graduates but struggle in those with the most, as well as in the states where the highest share of the workforce is employed in science, engineering, and computer occupations, all defining industries of the new knowledge economy. The 22 states with the biggest share of such workers have elected just six Republican senators, while fully 31 of the GOP’s Senate caucus represent the 20 states with the smallest share of such employment, according to census figures. Republicans are much stronger in states that rely on the powerhouse industries of the 20th century: agriculture, energy extraction, and manufacturing. . .  .
although two-thirds of Republicans say abortion should be illegal in all or most circumstances, 70 percent of all other Americans say it should remain legal in all or most cases. 
While a 55 percent majority of Republicans say small-business owners should be permitted to deny service to same-sex couples on religious grounds, almost three-fourths of everyone else disagrees. 
And while about three-fourths of Republicans say discrimination against white people is now as big a problem as bias against Black people, more than two-thirds of everyone else rejects that idea.

09 February 2022

Few Inmates Released To Home Confinement Due To COVID Committed New Crimes

A natural experiment arising due to COVID legislation reveals that home confinement for low level federal offenders (which is vastly less expensive, probably reduces recidivism and prison violence due to interactions with other inmates, and greatly reduces the spread of infectious disease), who made up about 20% of pre-COVID federal prison inmates, is vastly underutilized.

In all, 99.24% of prisoners released to home confinement due to COVID did not even commit a "technical violation" of their parole rules. Only 0.02% committed new crimes. None of those crimes was violent or harmed an unwilling third-party victim. 

Recidivism rates for inmates who serve their entire terms in prison are typically 25-65 times higher, with an even greater relative recidivism rate restricted to released inmates who commit new crimes, as opposed to technical violations of parole conditions.
More than 300 federal inmates who were transferred to home confinement as a pandemic mitigation strategy reoffended and were sent back to prison, a top federal official said Thursday. Bureau of Prisons Director Michael Carvajal told the House Judiciary Subcommittee on Crime, Terrorism, and Homeland Security that substance abuse was the “most common” offense that landed inmates back behind bars.

“About 160 of those 320 were for abuse of alcohol or drugs,” Mr. Carvajal said. “Some of them were escapes – they weren’t where they were supposed to be – most of them were violations of that nature. Some was misconduct, eight of those were new crimes committed, the rest of those were technical violations.”

A bureau spokesperson told The Washington Times that six of the eight new crimes were drug-related, one was for escape with prosecution and one was for smuggling non-citizens....

During Thursday’s hearing, he said the 320 reoffending inmates are among more than 37,000 who were transferred to home confinement since Congress passed the Coronavirus Aid, Relief, and Economic Security Act (CARES) in March 2020 to address threats posed by the pandemic.

The CARES Act allows the bureau to transfer certain low-level inmates convicted of nonviolent crimes to home confinement if they meet the COVID-19 risk factors identified by the U.S. Centers for Disease Control and Prevention. While some transfers have been put back in prison, others have completed their sentences and 5,485 inmates are still in home confinement.

For comparison purposes, in 2019, prior to COVID, there were 175,116 federal inmates (the group affected by the CARES Act). The CARES Act transferred about 20% of federal inmates to home confinement.

The CARES Act significantly reduced COVID deaths, hospitalization and infection rates for people who had been incarcerated in federal prison when the pandemic started in 2020 or were convicted of federal crimes after the pandemic started.

Federal and State Inmates Compared

The potential to reduce prison populations from a state equivalent to the CARES Act isn't as great as in the federal system, however.

This is because the one out of nine prison inmates who are incarcerated in the federal system includes a larger share of white collar crime offenders, non-violent drug crime offenders, and immigration law offenders (with the last two categories being classic "victimless crimes") than state prisons. 

But, federal prisons confine a far smaller share of violent criminals, and far fewer people who commit "blue collar" property crime offenders like people who commit larceny and burglary (even though some of the "worst of the worst" terrorists, hijackers, and kidnappers are often incarcerated in federal prisons).

Out of all people incarcerated in state prisons in the U.S., about 56% were convicted of violent crimes (mostly homicide, rape, robbery and aggravated assault), and 14% were convicted of burglary, car theft, or larceny and other non-violent "blue collar" property crimes, a combined 70%. About 5% of state prisoners are incarcerated for weapons possession violations.

About 14% of state prisoners are incarcerated for drug crimes, about 2% are incarcerated for fraud, and about 8% are incarcerated for other crimes, mostly regulatory offenses and felony DUI cases (the total number of state inmates adds to 99% due to rounding errors).

So, proportionately, far fewer state inmates would be eligible for a CARES Act styled release to home confinement. But, because there are 8 times as many state prisoners as there are federal prisoners, the absolute number of state inmates affected would still be significant.

In contrast, in federal prison, 8% of inmates are violent criminals and 1% committed non-violent "blue collar" property crimes (a combined 9%), and about 18% were convicted of non-violent weapons offenses, predominantly possession of a firearm by a former felon.

In federal prisons, drug offenses are the most serious offense conviction for 46% of inmates, immigration offenses make up 5%, private sector fraud offenses account for about 4%, and federal regulatory offenses like contempt of court (usually a serious violation of a court order), federal traffic felonies, tax fraud, bribery, perjury, prostitution, child pornography, gambling law, liquor law, national defense secrecy law,  hunting law, and environmental law felonies make up most of another 16% (although a small number within that percentage involve racketeering which is sometimes a white collar offense and sometimes a violent one, witness intimidation, extortion, and escapes that are more than technical), for a total of 74% of federal inmates (the total number of federal inmates adds to 101% due to rounding errors).

Inmate Citizenship

As an aside, due to the focus of the federal criminal justice system on immigration offenses and other crimes with international dimensions, 18.0% of federal inmates are not U.S. citizens, while only 5.7% of state inmates are not U.S. citizens (significantly less than in the general population, especially when comparing populations of similar age and gender to federal and state prison inmates respectively).

The lion's share of non-citizen prison inmates at both the state and federal level will be deported when they finish serving their sentences, greatly reducing the likelihood that those inmates will reoffend within the United States.

The Law Permits Gross Medical Mistreatment Of Prisoners In Most Cases

Allowing deadly and grossly negligent medical malpractice to go without a remedy because patients are incarcerated is fundamentally unjust.
The defense of qualified immunity for claims seeking monetary damages for constitutionally inadequate medical care for people who are incarcerated is misguided. 
According to the U.S. Department of Justice, medical illness is the leading cause of death of people incarcerated in prisons and jails across the United States. Qualified immunity in these cases limits accountability for carceral actors, thereby limiting incentives for improvements in the delivery of constitutionally adequate medical care. 
The qualified immunity defense also compounds other existing barriers, such as higher subjective intent standards and the Prison Litigation Reform Act, to asserting legal accountability of prison and jail administrators. 
In addition, the defense is not appropriate because medical care decisions by carceral actors are fundamentally different than traditional qualified immunity cases. Traditional qualified immunity cases usually involve discretionary decisions that are one-off, emergency, binary choices made by a single actor or unit of actors. In contrast, medical decisions in carceral settings are often serial, ongoing, and usually involve multiple decision makers, sometimes acting beyond their area of expertise. 
These significant differences between medical decisions in carceral settings and traditional qualified immunity decisions illustrate the practical difficulties for incarcerated plaintiffs and their families in holding prisons accountable for violating the U.S. Constitution. 
Recent developments refining the doctrine may lessen the negative impact of the defense on these civil rights claims, but they also do not address the core disconnect between the rationales justifying qualified immunity and its application in cases of severe injury or death from inadequate carceral healthcare.

08 February 2022

Improving Taxation In The United States

The federal income tax, payroll taxes, and gift and estate taxes in the United States don't collect enough from affluent individuals and businesses and is too complex for most taxpayers, while its most recent iterations of eliminated some tax breaks that are important for fairness. This post lists some of the changes that would be beneficial. It also lists a handful of suggestions for state and local taxation and the Medicaid program that are related to these reforms. 

Limited Liability Entity Taxation

* Tax all limited liability entities, all complex trusts, and all publicly traded partnerships, except tax exempt entities and RICs and REITs, as corporations. 

* Repeal the check the box regulations and establish transition rules for legacy S-corporations and LLCs.

* Tax limited partnerships which have some limited partners with limited liability and some general partners with unlimited liability as a general partnership of the general partners and a limited liability company made up of the limited partners collectively.

* Tax corporations at a flat rate equal to the highest individual income tax rate.

* Give corporations a deduction for dividends paid to shareholders (with the concept of "earnings and profits" to distinguish dividends from returns of capital retained), paid to U.S. taxpayers who are not tax exempt, for purposes of federal income taxes. For purposes of state income taxes, limit the dividends paid deduction to dividends paid to taxpayers subject to that state's income taxes.

* Tax dividends paid to U.S. taxpayers who are not tax exempt as ordinary income, eliminating the "qualified dividends" treatment of certain dividends, for purposes of federal income taxes. For purposes of state income taxes, tax dividends paid as ordinary income for taxpayers subject to that state's income taxes.

* Withhold taxes on taxable dividends paid to U.S. taxpayers (for federal income taxation purposes, and to taxpayers subject to that state's income taxes for state income tax purposes) at the highest individual income tax rate.

* Eliminate special taxes for domestic personal holding companies and the accumulated earnings tax.

* Eliminate the special deductions for income from pass through entities and for domestic manufacturing activities.

Capital Gain Taxation

* Tax capital gains as ordinary income.

* Do not allow capital losses to be applied to income other than capital gains.

Taxation Of Capital Gains At Death

* Treat assets owned by a decedent at death as if they were sold for fair market value on the date of death, subject to (1) a marital deduction, (2) the exclusion of gain on the sale of a personal residence that would have applied immediately prior to death (or half of that amount for a married decedent), (3) a limited step up in basis to fair market value at death, and (4) an ability to elect a carry over basis at death for select assets.

* Limit the step up in basis for capital gains at death to assets with a fair market value of $2,000,000 at death (without regard to the basis of those assets), applied as elected by the estate of the decedent in estate with assets that in the aggregate have a fair market value of more than $2,000,000 at death. 

* Eliminate the special step up in basis for capital gains tax purposes for community property.

* Allow a carry over basis at death election for assets to which the marital deduction does not apply for residences in which the recipient resides at the time of death, for vacant land, for farm real estate, for collectible tangible personal property like jewelry and art, for closely held business interests, and for property which cannot be liquidated at fair market value due to restraints upon alienation. The carry over basis must be disclosed on an asset by asset basis to the IRS and the recipient for each such asset for which an election is made.

Like-Kind Exchanges

* Eliminate Internal Revenue Code § 1031 like kind exchanges for real property. 

Tax Incentive Exclusions

* Eliminate (prospectively) exclusions and reductions in capital gains for qualified small business stock (IRC § 1202 stock), qualified opportunity zones, and similar provisions of the tax code.

Stock Compensation and Stock Option Compensation

* Give stock (i.e. equity interests) given in exchange for services as having a basis of zero.

* Do not make the grant or exercise of a stock option a taxable event (except to the extent that stock is sold in the transaction to pay for the stock option exercise price).

* Include all capital gains from the sale of stock received in exchange for services or through an employment compensation stock option as self-employment tax income.

* Include all dividends from stock received in exchange for services or through an employment compensation stock option as self-employment tax income.

* Include all capital gains and dividends from stock in a company in which the owner is an active participant as self-employment tax income.

* Eliminate the $1,000,000 cap on cash compensation for employees that encourages stock option compensation.

Allocation of Basis

* Require taxpayers to use average basis for fungible securities held with a firm or group of affiliated firms.

* Continue the carry over basis for gifts of appreciated assets including gifts to tax exempt entities.

Whole Life Insurance

* Tax the increase in the cash value of a life insurance policy with cash value prior to death, which is in excess of premiums paid that are in excess of term insurance premium established by regulation, as taxable income, with an exception for viatical settlements.

Gift and Estate and Generation Skipping Transfer Taxes

* Reduce the exclusion from gift and estate taxation to $2,000,000 per per, person lifetime, indexed, inheritable by a surviving spouse. Make all transfers exempt from gift and estate taxation on this basis also exempt from generation skipping transfer taxation.

* Set the estate tax rate at the maximum individual income tax rate.

* Set the gift tax rate and the generation skipping transfer tax rate at the equivalent on a tax exclusive basis to the maximum individual income tax rate on a tax inclusive basis.

* Treat split-interest trusts (charitable remainder trusts, charitable lead trusts, grantor retained interest trusts, qualified personal residence trusts, etc.) as incomplete transactions until the death of the grantor or the completion of the trust term, whichever comes first, with the gift deemed to be made and valued at that time.

* Disallow minority interest discounts (including lack of marketability discounts for a sale of less than a 100% interest in closely held entity) and ignore control premiums in gifts of entity interests.

* Disallow the annual exclusion for gifts of interests in entities, including purchases of entity interests up to the amount of an annual exclusion gift made that are made within one year of receipt of the annual exclusion gift.

* Disallow the annual exclusion for gifts to trusts with Crummy powers.

* Treat taxes paid for the benefit of an irrevocable trust (for gift and estate tax purposes) that is taxed as a grantor trust as a gift taxable gift to the trust.

Medicaid (The Poor Man's Estate Tax)

* Eliminate the Medicaid estate recovery system.

* Replace the Medicaid nursing home program income cutoff with a premium for the Medicaid nursing home program equal to income in excess of the cutoff, and double the amount of income that beneficiaries may keep.

* Increase the Medicaid asset cutoff for countable assets from $2,000 to $200,000.

* Allow gifts of up to $15,000 per beneficiary per year for Medicaid nursing home program participants without affecting eligibility.

Tax-Exempt Charities And Churches

* Tax the income of tax-exempt entities (e.g. charities and churches) from interest, dividends, capital gains, rent, royalties, and other sources of income from ownership of property at a flat rate equal to the highest individual income tax rate. In the case of payments of interest, dividends, and royalties paid by U.S. taxable limited liability entities or U.S. for profit businesses, withhold this at the source.

* End the charitable deduction for income tax purposes. Allow a deduction for advertising expenses paid to charitable entities by businesses for advertising.

* Eliminate the lobbying/political activity prohibition.

* Retain the charitable exemption for gift and estate and generation skipping transfer taxes.

* End the exemption for charities from property taxes and sales taxes.

Tax-Exempt Interest

* Eliminate the income tax exemption for all forms of municipal bonds that are currently tax exempt prospectively.

Social Security and Retirement Savings

* Make Social Security benefits tax free.

* Set the maximum income that can be considered in a defined benefit plan's benefit formula equal to the Social Security/self-employment income tax cap, which would be increased to the current defined benefit plan cap. Increase Social Security benefits to reflect this increased revenue if it can be done on an actuarially sound basis.

* Set a global cap on contributions from defined benefit plans and defined contribution plans (other than contributions in lieu of FICA taxes by governmental defined benefit plans) that can be made per year per person from all sources combined on a tax preferred basis of $10,000 per year, indexed, with defined benefit plans reporting an amount on an information return each year.

* Set a maximum dollar amount of combined defined contribution plan assets, which is reduced by a formula to take into account defined benefit plan benefits (but not below zero). If someone has defined contribution plan assets in excess that amount, the excess is a required minimum distribution in the following year. The limit would be $2,000,000 (reduced to zero at $100,000 of anticipated annual defined benefit plan benefits), indexed.

International Payments On Account Of Property

* Do not allow a deduction for payments made by U.S. taxpayers for property owned by foreign taxpayers, regardless of location, including rent, dividends, interest, and royalties on account of intellectual property.

Cash Flow Accounting For Investments and Businesses

* Eliminate deductions for depreciation, amortization and depletion (with deductions from existing transactions grandfathered).

* Allow expense deductions for capital expenditures that could previously not be expensed, but were instead deducted over time through depreciation, amortization or depletion deductions. 

* Treat the proceeds of loans incurred by for profit entities, or by individuals for business or investment purposes as taxable gross income. Allow income from loan proceeds to be carried forward one year rather than taxed in the current year at the election of the taxpayer.

* Treat principal payments on loans whose proceeds were taxable gross income as deductible.

Housing Cost Deductions

* Allow an itemized housing cost deduction up to a $36,000 per year indexed dollar cap on one or more properties owned or rented and used as a primary residence during at least three months a year by the taxpayer or a dependent of the taxpayer (this is derived from the value of the housing cost deduction for someone with a $750,000 mortgage, the largest allowed under current law, at current mortgage interest rates). Taxpayers with legacy mortgage interest that is deductible could elect to take that deduction rather than the housing cost deduction.

* The itemized deduction is available for rent, imputed income from tax free use of employer provided housing, qualified mortgage interest, mortgage insurance, HOA charges, property taxes, homeowner's insurance, renter's insurance, earthquake insurance, and flood insurance.

* Qualified mortgage interest would be limited to purchase money mortgages, mortgages used to pay for construction, renovation, or repairs, or refinancing of that debt. There would be no deduction for cash out home equity loans not reinvested in the collateral.

* Eliminate the minister's housing allowance exclusion.

Health Care Deductions

* Continue the exclusion from income for employees, and the deductibility to employers, of health insurance premiums and healthcare savings account contributions.

* Allow a deduction, above the line, without regard to income (but not reducing income below zero or subject to carry forward or carry back) for purposes of both income taxes and also for purposes of self-employment taxes, of health insurance premiums actually paid plus excess Obamacare premium credits paid to IRS on one's return, less Obamacare premium credits received on one's return.

* Allow an itemized deduction for uninsured medical expenses in excess of 2% of AGI per year.

Business Expenses

* Do not allow a business expense deduction for meals, lodging, or entertainment, unless the beneficiaries are employees or contractors who have this in kind form of compensation reported on their W-2 or 1099.

* Limit net operating loss carry forwards to three years, do not allow net operating losses to reduce income other than income from that business, and do not allow NOL carry forwards to reduce more than 50% of current taxable income from operating profits from the same business in any given year.

Special Standard Deduction

* Eliminate the special standard deduction for the elderly and the blind in order to simplify tax laws.

Simplified Earned Income Tax Credit

* Repeal the earned income tax credit.

* Add an income tax credit for everyone, never phased out, equal to 7.65% of the federal poverty line for the taxpayer (based upon filing status and number of dependents), and reflected in withholding taxes, up to a maximum of the sum of FICA taxes paid plus one-half of self-employment taxes paid. 

Reinstated Deductions

* Reinstate the casualty loss itemized deduction, without dollar/percentage limitation.

* Reinstate the cost of earning income itemized deduction, without dollar/percentage limitation, including a deduction for mandatory occupational licensing fees.

* Reinstate the state and local taxes itemized deduction for state income taxes, without dollar/percentage limitations, but disallow it for state and local property taxes (except as part of the new housing cost deduction), and disallow it for state and local sales and use taxes, and other state and local taxes.

07 February 2022

Do Androids Dream Of Wedded Bliss?

Noted, with apologies to Philip Dick.
In the era of 4th industrial revolution, fascinating innovations can be seen in the field of robotics. The emotional intelligence of robots as well as human sympathy towards them is increasing. A human-robot marriage in future would pose challenges to lawmakers including whether human-robot marriage has a legal worth? and how these families will deal with children, property and issues related to liabilities. 
This article is the very first in Central Asia to consider the family law implications of the romantic relationships that applied scientists are working to develop. It argues that the advancements in humanoid robotics may pose challenges to the current understanding of family law in Central Asia.

Northern Ireland v. Republic Of Ireland

The two sovereignties on the island of Ireland are very well sorted already.
one statistic stands out from a census comparison from the first decade of the twenty-first century. Just 2.1 percent of the population in Northern Ireland were born in the South, and just 1.3 percent living in the South were born in the North.
And that is with rights of free migration.

Via Marginal Revolution. 

05 February 2022

Until 1945, Polygamy Was Legal In Japan

Not really all that surprising, but, interesting to know.

Until 1945, when Japan was defeated in World War II and a new constitution was promulgated, polygamy was still legal. Multiple wives, their children by one father, and their relatives were regarded as one family.
From here.

04 February 2022

Jobs Not Quite Back To Pre-Pandemic Levels But Getting There

The U.S. hasn't fully recovered economically from the pandemic, but it's getting there, and the pandemic still isn't over. The U.S. economy is on track to a full jobs recovery sometime this year.


From the New York Times which reports that:

The number of long-term unemployed people — those jobless for six months or more — declined to 1.7 million, down from four million a year earlier, though still 570,000 higher than in Feb. 2020 just before the pandemic took root. . . . 
There are 2.9 million fewer jobs now than before the pandemic, but as Elise Gould of Economic Policy Institute points out, if you take population growth into account, the shortfall is 4.5 million.

Employment recoveries in the 2001 and 2007 recessions were much slower (via Calculated Risk).


The Bible Belt Concept Is Not A Myth

In this case, the image largely speaks for itself. 

It is also worth noting that the sects within Christianity present in the "Bible Belt" are significantly different, with more Evangelicals, and fewer Mainline Protestants and Catholics and Jews than elsewhere.

But this is changing over time somewhat.

In 2006, 23 percent of Americans were white evangelical Protestants, according to the Public Religion Research Institute. By 2020, that share was down to 14.5 percent. 
In 2020, 22 percent of Americans 65 and older were white evangelical Protestants. Among adults 18 to 29, only 7 percent were.

Denver's Tight Housing Market

It's a seller's market in Denver's housing market right now. 

There were 486 active real estate listings in Denver yesterday, including lots and mobile homes, according to a friend of mine who follows these things. This is down from the start of 2022 when there were only 1,477 active properties on the market in the Denver (968 single family homes and 509 condos), which is 11,175 fewer houses on the market than usual.

Denver's population was 715,522 at the 2020 United States census, a 19.22% increase since the 2010 United States census. The average household size in Denver is 2.29 people. Denver has about 312,455 households in all, and Denver's demand for home went up by 50,372 homes in the last decade, on average, 5037 new households per year.

About 20% of people in Denver, in a typical year, live someplace different than they did a year ago. So there are a lot of people looking for new places to live.

As of July 1, 2019, there were 338,341 housing units in Denver. Denver issued 5,059 building permits in 2020, some of which was for commercial properties, but some of which was for apartment buildings with more than one residential unit. So, supply and demand are neck and neck. This has led to soaring housing prices.

Also, it is worth noting that while Denver's population is rising, that enrollment in the Denver Public Schools is actually falling significantly, to the point where the district is planning to close schools and lay off teachers and staff. 

Migrants to Denver are apparently disproportionately childless adults (often Millennials), and people are having fewer children. Indeed, the high cost of housing in Denver, fundamentally driven by a failure of housing construction to keep up with demand, is one of the reasons people are having fewer children.

Housing prices in Denver are soaring at far more than the rate of inflation, eyeballing it, an increase of 125% from 2012 to 2020 (an average rate of increase of 10.7% per year).


In 2021, the average price of a single family home in the Denver metro area was $612,274, up 16.68% over 2020, an all-time high and the tenth consecutive year of rising housing prices. 

In December 2021 in the Denver metro area the median price for a residence was $545,000 (average $626,573), the median price for a single family home was $599,990 (average $705,753), and the median price for a condo was $381,500 (average $441,390), all of which are record highs.

Rents in Denver are no better. As of October 2021:
[A]ccording to October’s National Rent Report from Zumper, the third largest online rental platform in the U.S.

Since pandemic closures swept the nation in March 2020, Denver’s median one-bedroom rent has risen 11.8 percent, and two-bedrooms grew 14.3 percent. In 2021, those rates have climbed 20.7 percent — making Denver the sixteenth priciest rental market in the U.S.

Median Denver rent for a one-bedroom is $1,690, and $2,190 for a two-bedroom. . . . One-bedroom rent prices are highest in New York City, where they’re $3,100, followed by San Francisco at $2,800 and Boston at $2,530.
There also aren't lots of rental vacancies. In 2021, "metro Denver’s apartment vacancy rate plunged from 5.5% in the first quarter to 3.7% in the second[.]"

In contrast, "the median rent in metro Denver, including the incentives offered by landlords, was $805 in the first quarter of 2010, according to RealPage." This was an increase of 81% from 2010 to 2018. 

Another source says that average rents in metro Denver were up 85% from 2010 to 2019 (somewhat less than the 105% increase in the median housing price in that time period in the metro area). There were 61,700 apartment units built in the Denver metro area from 2010 to 2019. 

Meanwhile, median household income in metro Denver was up only 55% from 2010 to 2019. Inflation from 2010 through 2022 has cumulatively been 28% (nationally).

Zillow puts the increase in rent from 2010 to 2019 at 88% in the Denver metro area.

This is a stark contrast with metro Denver from 2000 to 2010, when metro area rents grew at slightly less than the rate of inflation (a 22% increase in nominal dollars and a 2% drop after adjusting for inflation). 

Moreover, since the surge in prices is driven by the fundamentals of demand outstripping supply, this doesn't appear to be just a speculative price bubble that could pop at any time.

Plastics

Materials science doesn't have quite the intellectual cache of fundamental physics, but it can still do some pretty cool things.

Using a novel polymerization process, MIT chemical engineers have created a new material that is stronger than steel and as light as plastic, and can be easily manufactured in large quantities.

The new material is a two-dimensional polymer that self-assembles into sheets, unlike all other polymers, which form one-dimensional, spaghetti-like chains. Until now, scientists had believed it was impossible to induce polymers to form 2D sheets.

Such a material could be used as a lightweight, durable coating for car parts or cell phones, or as a building material for bridges or other structures, says Michael Strano, the Carbon P. Dubbs Professor of Chemical Engineering at MIT and the senior author of the new study.

“We don’t usually think of plastics as being something that you could use to support a building, but with this material, you can enable new things,” he says. “It has very unusual properties and we’re very excited about that.”

The researchers have filed for two patents on the process they used to generate the material, which they describe in a paper published in Nature on February 2, 2022. MIT postdoc Yuwen Zeng is the lead author of the study.

From here.

Quote Of The Day

Our hero talks with the ghost who haunts his rental house: 

From Wilde Life (Episode 1021).

03 February 2022

Modern Pirates

Piracy has been an issue in several places in the 21st century, there have been hot spots in the vicinity of Somalia, in island Southeast Asia, and most recently and predominantly, in the Gulf of Guinea.

Worryingly, the security threats in west Africa now include piracy in the Gulf of Guinea. In 2020, all but one of the world’s 28 kidnappings recorded at sea occurred in these waters. Similarly, in 2018, all six hijackings at sea, and 13 of the 18 incidents of ships fired upon occurred in the Gulf of Guinea. Of the 141 hostages held at sea that year, 130 were captured by pirates here.
From the Financial Times.

In the Americas, in contrast, it appears that drug and arms smuggling, and human trafficking, have become bigger concerns than out and out piracy.

02 February 2022

Partnership Taxation Is The Brain Surgery Of Tax Law But Shouldn't Have To Be

Partnership taxation is the most intellectually challenging part of federal tax law. Done right, it usually comes to the intuitively correct solution, but the way it gets there is rarely intuitive. This is a problem of increasing importance. Since the vast majority of limited liability companies (LLCs) with more than one member are governed by partnership accounting rules, that were previously used much less widely and are often micro-businesses run by amateurs, this issue has become far more pressing that it used to be.

There are a couple of things that make it particularly difficult. One is that allocation of entity level items of revenue and expense and credits are not necessarily linked directly to actual cash transactions with partners. The other is that there is a parallel set of accounts for inside and outside basis whose reconciliation is tricky.

The Tax Profs blog notes:
Andrea Monroe’s article, Making Tax Law Work: Improvisation and Forgotten Taxpayers in Partnership Tax, boldly calls on partnership tax experts to understand their role in normalizing dysfunction within partnership tax law and to support reform that is mindful of all partnerships.

Although millions of business entities are taxed as partnerships, assets and income are concentrated in a small number of them. As Monroe notes, drawing on IRS data from 2018, “less than 1 percent of partnerships held greater than 76 percent of partnership assets, and approximately 73 percent of partnerships held roughly 1 percent of partnership assets.” This suggests great differences among tax partnerships, yet, as partnership income and deductions are taxed to the partners and not the partnership, all tax partnerships must allocate their income and deductions to their owners. ...

Andrea Monroe’s article is a critical and timely reminder that the tax system, including the highly difficult portion applicable to tax partnerships, “only works if the vast majority of [taxpayers]—whether rich or poor, forgotten or elite—can participate.”
The paper and its abstract are as follows:
There is a growing awareness that federal tax law caters to a small number of wealthy and well-advised taxpayers without regard for the rest of the taxpaying public, and partnership tax is a prime example. This article explains how complexity and indeterminacy have transformed partnership tax, harming millions of forgotten taxpayers who struggle to comply with their annual filing obligations. A root cause of this phenomenon is the professional culture of elite practitioners, policymakers, and scholars at the heart of the partnership tax system.

The most troublesome provisions of partnership tax are also its most fundamental, namely the allocation rules that regulate how partners share a partnership’s taxable items. Complexity is a universal problem faced by partnerships at all levels of wealth, status and sophistication, and the vast majority of taxpayers respond with improvisational tax compliance. In remarkably diverse contexts, improvisation has replaced technical compliance as the norm in partnership allocations. Wealthy partnerships make a strategic choice to improvise, using “target allocations,” while poorer partnerships improvise because they have no other choice, routinely following “intuitive” tax law and hoping for the best.

Reframing this complexity problem as a shared experience of all partnerships exposes the technical and cultural fractures of partnership tax in a new and different light. First, the technical rules governing partnership allocations do not work as designed for any category of partnership. A second, less explored problem is the professional culture of partnership tax, which takes for granted the technical sophistication of substantive tax law without appreciating the distributional consequences of sustained complexity and improvisation.

Partnership allocations require more than technical solutions. One necessary step is addressing the professional culture of partnership tax to rethink what it means for tax law to work. This article proposes that partnership reforms developed by experts and directed at wealthy and well-advised partnerships should be accompanied by reforms addressing parallel problems faced by forgotten partnerships. The solutions will necessarily differ, but a bilateral focus on the universal problems of all partnerships would represent meaningful progress, signaling a commitment to a fair, principled, and representative system of partnership tax.
Monroe, Andrea, Making Tax Law Work: Improvisation and Forgotten Taxpayers in Partnership Tax (May 1, 2021). University of Michigan Journal of Law Reform, Forthcoming, Temple University Legal Studies Research Paper No. 2021-23, Available at SSRN: https://ssrn.com/abstract=3838058

U.S. Support For The Ukraine Is Lukewarm

Russia is massing 100,000 troops on Ukraine's border in a transparent attempt to annex much of the eastern part of the Ukraine which has been controlled by pro-Russian rebels backed not quite officially, but not quite covertly either, by the Russian government. Russia seeks to add this territory to the Ukrainian territory that it acquired in its swift military imposed annexation of Crimea in 2014, which is still not widely recognized in the international community, before Ukraine or any other country could put up a fight.

The U.S. reaction to this conflict has been sympathetic to the Ukraine's plight, but it hasn't committed itself to decisive action to defend its former Soviet ally either.
Several thousand troops will be sent to NATO member nations in Eastern Europe to reassure allies anxious over tensions surrounding Ukraine. The U.S. has said it will not deploy troops to Ukraine in the event of conflict there.
President Biden has approved the deployment of about 3,000 additional American troops to Eastern Europe, administration officials said on Wednesday.

The troops, including 1,000 already in Germany, will head to Poland and Romania, the Pentagon spokesman, John F. Kirby, said. Their purpose will be to reassure NATO allies that while the United States has no intention of sending troops into Ukraine, where President Vladimir V. Putin of Russia has been threatening an invasion, Mr. Biden would protect America’s NATO allies from any Russian aggression.

“Its important that we send a strong signal to Mr. Putin and the world that NATO matters,” Mr. Kirby told reporters at a news conference. “We are making it clear that we are going to be prepared to defend out NATO allies if it comes to that.”

At the moment, Russia is threatening Ukraine, not Romania or Poland. But Mr. Putin has made clear his distaste for both NATO and the post-Cold War redrawing of the map of Europe, which put former Soviet republics and satellite countries in the West’s foremost military alliance at his doorstep.

The president’s decision comes days after Pentagon leaders said that Mr. Putin had deployed the necessary troops and military hardware to conduct an invasion of Ukraine. 
From the New York Times.

Germany, which depends upon Russia for natural gas supplies, has also been unwilling to that a firm stand against Russia's aggression, while the United Kingdom, which is less economically dependent upon Russia, has supplied arms including anti-tank missiles to the Ukraine.

Rebel controlled Eastern Ukraine and Crimea are the most ethnically and linguistically Russian parts of Ukraine that were included in it at a time when Ukraine was just one more top level regional government in the Russian majority Soviet Union until it became an independent country with the collapse of the Soviet Union in 1991, and Crimea was something of an afterthought, added to the Soviet Republic of the Ukraine after the rest of its territory.

Politically, the Ukraine is divided, more or less, on an East-West continuum, with the east being more conservative, pro-Russian, and anti-Western, and the West being more similar politically to the Eastern European countries that have joined NATO.

If these transfers had been accomplished through a diplomatic agreement, the West would have supported this as a way of affording these regions self-determination. But as it happened, Russian involvement in Ukraine violated a sovereign nation's boundaries and territory by means of unilateral military force, signaled an unwillingness of Russia to abide by international law and norms, and marked an effort by Russia to rebuild as much of the Soviet empire as it can manage through aggressive military actions contrary to the rule of law.

Russia is no longer a communist country. Instead, it is a partially democratic Republic with a corrupt kleptocratic capitalism run by newly emerged oligarchs, that supports a militaristic nationalism, has reestablished its historic alliance with the Russian Orthodox church that had been suppressed during the Soviet era. The end of communism produced intense economic malaise and triggered a wave of deaths of despair that seriously lowered the life expectancy of Russian men. But thirty years later, Russia's economy and state capacity have consolidated and recovered somewhat, although still probably to a point below that of its Soviet peak compared to other world powers.

Russia, with only about half of the population of the former Warsaw Pact of the Soviet Union and its tributary Eastern European states, simply couldn't support the Soviet Union's former military might, and wasn't helped by having key parts of its defense industry based in the Ukraine disassociate itself with Russia's military-industrial complex which now had it in its cross-hairs. 

Russia's national political leader, Vladimir Putin, is a demagogue and an autocrat, who hasn't quite fully achieved the totalitarian dominance of some of his Soviet and pre-Soviet predecessors. But he has shown now qualms about riding herd on the democratic process domestically, and breaking international law to achieve his ends. 

One of his greatest achievements to date has been to win a war against insurgents in Chechnya, previously an autonomous region within Russian rather than at the Soviet level, who were not granted to independence despite having perhaps the most legitimate grounds to deserving it of any former Soviet polity. He did so by convincing rebel leaders to become his personal allies in exchange for special treatment as his personal enforcers in disordered Russia.

For most of the last thirty years, Russia has had a hollow military of ill maintained major weapons systems and ships, and sailors and soldiers at a low level of readiness. But one of Putin's signature policies has been to rebuild Russian military might on a more sound footing, and he has had significant successes on that front, which he is now seeking to utilize for his political advantage in foreign affairs.

Russia has been active ruthlessly asserting itself, often militarily, overtly or covertly, in what it sees as its sphere of influence in numerous former Soviet countries.

In this context, the U.S. response to Russian aggression, not just by Biden, but by his predecessors, Presidents Trump and Obama, has reeked of appeasement. It looks like Biden is inclined to continue on that path.

This approach also begs the question of why the U.S. spends so much on its own military. If it actually had the resolve to engage in near peer military conflict with Russia, some of its massive expenditures might make sense. But if the U.S. isn't actually going to use the military might it has spend so much of its treasure to acquire when a real conflict that calls for those kinds of resources finally arises, it is hard to know why the silent sacrifices that our nation made to buy those military resources was worth it.

If States Were Countries, How Many Of Us Would Be Immigrants?

We can get focused on immigration to the U.S. from outside the U.S., and lose track of the massive amount of internal migration that the United States has as well. 

Also, since every state has people both leaving it and moving there, the net population changes attributable to migration understate the extent to which the U.S. population churns between states. 

This also suggests that "voting with one's feet" is a significant force in the incentives facing individual states in our federal system, not just in the highly publicized area of competitions between states to win new federal government and business jobs, but at the level of individuals.

Generally speaking, a high percentage of people who were born outside the state is a positive economic indicator, that suggests something is attractive about the state that is bringing people there, while a low percentage of people who were born outside the state is a negative economic indicator. The linked story called the places where the most people didn't move "the stuck belt." 

Percentage of people age 25 years or older in each state who were born in that state via Bloomberg in a March 5, 2019 story by demographer and regional development economist Richard Florida who in turn is relying on data from the 2017 American Community Survey (which the Census Bureau in the U.S. Department of Commerce conducts between decennial censuses). 

The linked story notes that: 

Nearly six in ten Americans (58.5 percent) currently reside in the state where they were born. There is a minuscule difference between men and women: A slightly higher percentage of men (58.8 percent) lived in their birth state compared to women (58.2 percent).

The 12 States With The Most Mobile Populations

In one state, Nevada, only 10% of residents over age 25 were born there. 

In three more states, more than 20% but less than 30% of residents over age 25 were born there. Those state are Florida (22%), Arizona (23%), and Alaska (27%). 

In eight more states, more 30% but less than 40% of residents over age 25 were born there. Those states are Washington State, Oregon, Idaho, Wyoming, Colorado,  Maryland, Delaware, and New Hampshire. 

All but four of the states with the lowest percentage of people over age 25 who were born there are in the West, and those four states are all on or near the East Coast.

Age And Migration

Anecdotally, three of the states with the lowest percentage of residents over age 25 who were born there: Nevada, Florida and Arizona, are known for their large communities of migrating retirees. It is plausible that migration patterns may be quite different for retirees and for people of working age. The data don't unequivocally confirm this intuition, however.

A map showing a breakdown of states by the percentage of the population age 65+ sheds some light on this, although it doesn't distinguish between migrants and people born in the state:

From here, also noting that:
Across the total U.S. population, 16.0 percent of Americans are over the age of 65, while 6.7 percent are over the age of 75. The median age in the United States is 38.2.

This source notes which states have the fewest seniors:

The three states with the most youthful populations are Utah, Alaska, and Texas. These three states are home to residents over age 65 who make up 11.1, 11.9, and 12.5 percent of the total population, respectively.

In Utah, this is due to the high birth rates of the Mormon majority. In Alaska and Texas, this is probably driven mostly by migration of younger people to these states, particularly in connection with the oil and gas industry, although a large Hispanic Catholic population and lots of immigration from Mexico may be another factor in Texas. This may also be driven by seniors moving away from the tough climate of Alaska to warmer destinations further south. 

The U.S. states with the largest percentage of the population over age 65 (from the same source) are:

1. Maine 20.6%
2. Florida 20.5%
3. West Virginia 20%
4. Vermont 19.8%
5. Montana 18.8%
6. Delaware 18.7%
7. Hawaii 18.4%
8. Pennsylvania 18.2%
9. New Hampshire 18.1%
10. South Carolina 17.7%

Some of these states are predominantly migrant populations, some are states in the "struck belt", and some are in between.

The 14 States In The Stuck Belt

In eleven states, more than 60%, but not more than 70% of residents over age 25 were born there. Those states are North Dakota, Minnesota, Wisconsin, Iowa, Missouri, Indiana, Pennsylvania, West Virginia, Kentucky, Mississippi, and Alabama. 

In three states, more than 70% of the residents over age 25 were born there. Those states are Ohio (71%), Michigan (72%), and Louisiana (74%).

Illinois (at about 55%) is the only state in the Midwest where less than 60% of residents over age 25 were born there, and that is without a doubt, predominantly due to the Chicago metropolitan area.

These states have been affected by interstate migration as well, but more by emigration than immigration.

Every state, however, has at least 26% of residents over age 25 who were not born there.

The 24 In Between States

In the remaining twenty-four states, more than 40% but less than 60% of residents over age 25 were born there. 

[The] larger coastal states like California and New Jersey have rates in the low 40 percent range. New York and Illinois have significantly higher shares of people, roughly 55 percent, who were born in those states.

Foreign Born Migrations v. Interstate Migrants. 

The percentages of the population not born in each state includes both foreign born people who were born outside the U.S. and interstate migrants. The percentage of the total population born outside the state in some select states is as follows:

California 26.7%
New Jersey 23.4%
New York 22.4%
Florida 21.1%
Nevada 19.8%
Massachusetts 17.3%
Texas 17.1%
Maryland 15.4%
Washington 14.9%
Illinois 13.9%
Arizona 13.4%
Virginia 12.7%
Georgia 10.3%
North Carolina 8.4%
Pennsylvania 7.0%

In many states in the Northeast, a very large share of all people in each state who weren't born there are foreign born.

The percentage of people in Nevada who are foreign born is less remarkable when one considers that only 10% of residents over age 25 in Nevada were born in the state.

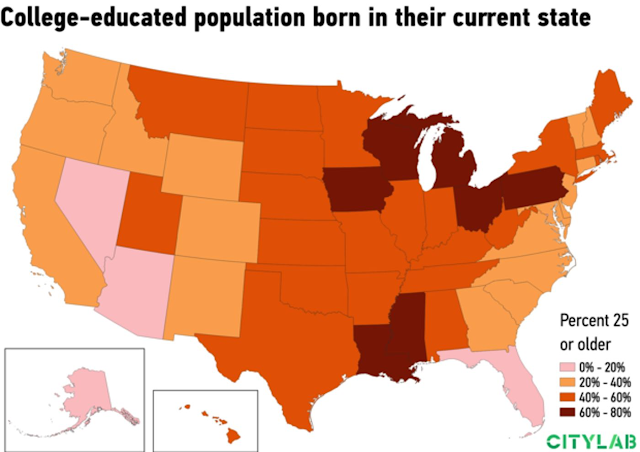
Education and Mobility

The link between education and mobility isn't particular consistent. The story also parses out the data by education level: 

Louisiana again tops the list with nearly two-thirds of its adults who hold a bachelor’s degree or more remaining in the state, followed by Michigan (64 percent), Ohio (63 percent), and Mississippi and Iowa (62 percent).

The most significant way in which U.S. states discriminate based upon state residency is by charging significantly less for tuition a state colleges and universities to students who are state residents than to students who reside outside the state (although some states are more strict about this than others, and there are a few states, mostly smaller states with less complete higher educational offerings, with interstate compacts allowing residents of states that are part of the compact to receive in state tuition at a sister state, and there are some state colleges and universities that offer instate status or special scholarships to members of certain Indian tribes outside the state, such as Miami University of Ohio for members of the Miami Indian tribe).

Presumably, because economics teaches us that incentives matter, this means that new high school graduates are more likely to attend college in their own state than they are in another state. The high percentages of in state students at most state colleges and universities, especially the less academically selective ones, supports this conclusion. Thus, this distinction provides a return on taxes paid to parents have lived in the state and mostly paid significant taxes, since parents of students attending state colleges and universities, especially the more selective ones that have the highest subsidies per student, are much more affluent than average parents in those states. 

Statistics about the likelihood of state college and university students living in a state after graduation (which is when the general public in a state receives the benefit of this state subsidy) are harder to come by. But it is safe to guess, from mere inertia, that graduates of state colleges and universities in a state are more likely to live in that state after graduating than graduates of colleges and universities outside the state (and probably also, are more likely to do so than students of the more selective of the private colleges and universities within the state). 

As a matter of economic development policy, a state would typically like to lure smart students from outside the state to go to college there, with the hope that those students will later contribute to that state's economy, although no state binds graduates of its colleges and universities to do so. This may happen behind the scenes to some extent through scholarships awarded to out of state students at more selective state colleges and universities. But the tuition tax breaks given to in state students at almost every state college and university without regard to merit or financial need, suggest that this reason for funding state colleges and universities is not a primary motive for state legislators funding state colleges and universities in state budgets. 

In contrast, many European countries extend the full economic subsidies they provide to domestic college students to college students from abroad enrolling in their regular college and university programs.


Louisiana again tops the list with roughly three-quarters of its adults who did not complete high school native to the state as does West Virginia (75.6 percent), followed by Mississippi (72.9 percent), and Kentucky (72.6 percent).

There is only one state, New York, where college graduates are much more likely to stay in their birth state than high school dropouts, while there are six states (Alaska, Georgia, South Carolina, Virginia, Vermont, and Maine) where high school dropouts are much more likely to stay in their birth state than college graduates. 

The remaining 33 states are fairly evenly split between states where college graduates are a little more likely to stay and states where high school dropouts are a little more likely to stay. This shows some regional trends but it isn't entirely obvious what is driving those trends.