Things that make life suck in general, significantly increase one's probability of dying for adults.
A history of divorce is the second highest risk factor after being a current smoker and ahead of a history of smoking. Recent financial difficulties and a history of unemployment adds more to your risk than being male.
In the current investigation, we compare 57 factors within a multidisciplinary framework. These include (i) adverse socioeconomic and psychosocial experiences during childhood and (ii) socioeconomic conditions, (iii) health behaviors, (iv) social connections, (v) psychological characteristics, and (vi) adverse experiences during adulthood.
The current prospective cohort investigation with 13,611 adults from 52 to 104 y of age (mean age 69.3 y) from the nationally representative Health and Retirement Study used weighted traditional (i.e., multivariate Cox regressions) and machine-learning (i.e., lasso, random forest analysis) statistical approaches to identify the leading predictors of mortality over 6 y of follow-up time.
We demonstrate that, in addition to the well-established behavioral risk factors of smoking, alcohol abuse, and lack of physical activity, economic (e.g., recent financial difficulties, unemployment history), social (e.g., childhood adversity, divorce history), and psychological (e.g., negative affectivity) factors were also among the strongest predictors of mortality among older American adults.From PNAS.
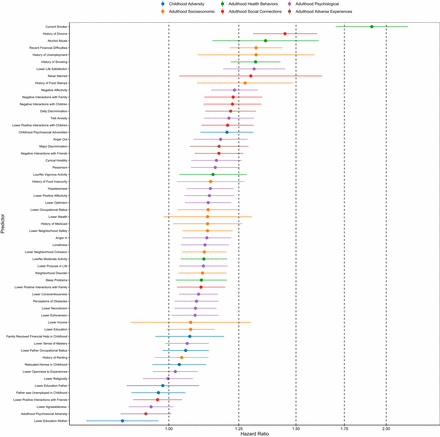
The money chart:
Variable -- HR -- 95% CI
Current smoker1.91--1.70, 2.14
History of divorce1.45--1.31, 1.60
Alcohol abuse1.36--1.15, 1.61
Recent financial difficulties1.32--1.22, 1.44
History of unemployment1.32--1.10, 1.59
History of smoking1.32--1.22, 1.43
Lower life satisfaction1.31--1.19, 1.45
Never married1.30--1.03, 1.63
History of food stamps1.28--1.09, 1.49
Negative affectivity1.23--1.14, 1.33
Negative interactions with family1.23--1.12, 1.35
Negative interactions with children1.22--1.12, 1.34
Daily discrimination1.22--1.12, 1.32
Trait anxiety1.21--1.12, 1.31
Lower positive interactions with children1.21--1.11, 1.31
Childhood psychosocial adversities1.20--1.11, 1.31
Anger out1.18--1.08, 1.28
Major discrimination1.17--1.07, 1.29
Negative Interactions with friends1.17--1.08, 1.27
Cynical hostility1.16--1.07, 1.26
Pessimism1.16--1.07, 1.25
Low/no vigorous activity1.15--1.03, 1.28
History of food insecurity1.14--1.02, 1.27
Hopelessness1.14--1.06, 1.23
Lower positive affectivity1.14--1.05, 1.23
Lower optimism1.13--1.05, 1.22
Lower occupational status1.13--1.03, 1.25
Lower wealth1.13--0.98, 1.30
History of Medicaid1.13--1.01, 1.26
Lower neighborhood safety1.13--1.04, 1.23
Anger in1.13--1.04, 1.22
Loneliness1.12--1.04, 1.21
Lower neighborhood cohesion1.12--1.04, 1.20
Low/no moderate activity1.12--1.04, 1.20
Lower purpose in life1.12--1.03, 1.21
Neighborhood disorder1.11--1.03, 1.20
Sleep problems1.11--1.02, 1.20
Lower positive interactions with family1.11--1.03, 1.20
Lower conscientiousness1.10--1.03, 1.17
Perceptions of obstacles1.09--1.02, 1.17
Lower neuroticism1.09--1.02, 1.16
Lower extroversion1.09--1.01, 1.17
Lower income1.07--0.88, 1.30
Lower education1.07--0.99, 1.16
Family received financial help in childhood1.07--0.96, 1.19
Lower sense of mastery1.06--0.99, 1.14
Lower father occupational status1.06--0.98, 1.14
History of renting1.04--0.96, 1.14
Relocated homes in childhood1.03--0.95, 1.13
Lower openness to experiences1.02--0.95, 1.10
Lower religiosity1.00--0.92, 1.08
Lower education father 0.98--0.87, 1.10
Father was unemployed in childhood 0.97--0.89, 1.05
Lower positive interactions with friends 0.96--0.89, 1.04
Lower agreeableness 0.94--0.88, 1.02
Adulthood psychosocial adversity 0.93--0.86, 1.01
Lower education mother 0.86--0.77, 0.97
No comments:
Post a Comment